Bears wreak havoc in the crypto market and major coins bleed out in the lower and higher timeframes. Bitcoin (BTC) is on a downtrend with a 9% correction over the past day and 20.9% in the 7-day chart. With a market cap below $1 trillion for the first since February, the price action seems to favor the pessimists.

However, analyst William Clemente has pointed towards the current funding rate for BTC futures across all exchanges. At the time of writing, this metrics stands at 0.03%. As the chart below shows, every time BTC’s futures funding rate reached these levels, the price was able to gain momentum and run hot towards new highs. The analyst said:
Some Silver Lining: Greed has been flushed out of the bitcoin market. These resets in funding rates have been a good gauge of market sentiment. Usually when the market is the most hesitant to go long is the best time to go long in bull markets. We are very close to a bottom.

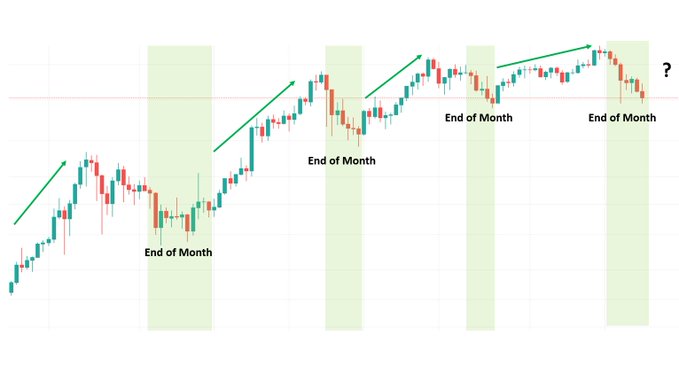
A high number of leverage positions and its subsequent liquidation during last week is one of the reasons for BTC’s price action. However, in the past months, Bitcoin has been forming a pattern. As Clemente also pointed out, the cryptocurrency trends downwards towards the end of the month only to resume its rally.

Two other metrics indicate possible appreciation in BTC’s price. First, the Spent Output Profit Ratio (SOPR), metric used to measure Bitcoin holders’ profits and losses. Now, as Clemente said and shows in the chart below, the SPOR is approaching its reset mark close to 1.
As the bull market extends and retail investors take action, it becomes more likely for BTC’s SOPR to drop below 1 and offer “great buy opportunities”. Clemente said:
Currently, SOPR is approaching the full reset mark, meaning price has either reached, or is very closing to reaching, the bottom of the current correction.

But perhaps, the most bullish metric is Bitcoin miner’s Net Position Change, a metric used to measure the amount of buying and selling pressure for this sector. Since the start of April, miners have stopped selling their supply and have begun on an accumulation trend. Much different than the 2016 and 2017 bull market, as the analyst said:
Throughout the 2016/2017 bull market, miners consistently sold. This is a key differentiating factor between that cycle and the current one, possibly made possible by newly matured Bitcoin borrowing/lending platforms.
Bitcoin Bears Could Continue Their Assault
On the other hand, trader Bob Loukas claims yesterday’s crypto crash has been the first since March 2020, when the “Black Thursday” took BTC below $4,000. Therefore, he believes something has been broken in the market’s structure ending the rally that took Bitcoin to the current levels.
In the short and medium term, investors should take gains and rotate their position for maximum profit, according to Loukas. The next phase could be comprised of consolidation and lower levels in May. However, the trader highlighted that everything remains as a possibility and not a prediction, he added the following:
For those worried about an end to the bull market already, I say, VERY MUCH doubt that. This bull market has been coming light a freight train and I’ve yet to see anything close to resembling the type of high (top) you expect before a crash.


